

3.22 Widget Table
Widget tables are designed for the case where you need a repeating pattern of components for sets of identical equipment or datasets. For example, if you have a hotel with an airconditioning unit in each room measuring temperature, pressure, humidity and CO2. Each row can be a different room.
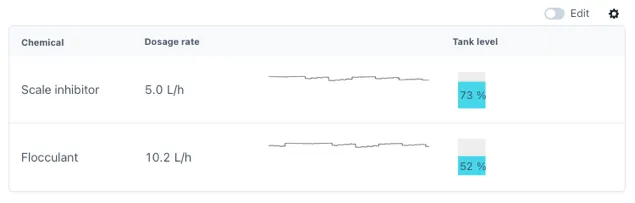
Widget tables can include different types of widgets in them, and they provide the possibility of linking each widget to their own distinct data source. This is ideal for joining data from multiple sources in a single table for easier comparison between them. The following is an example of what a widget table can look like, this will very according to the widgets you wish to use in your widget table.
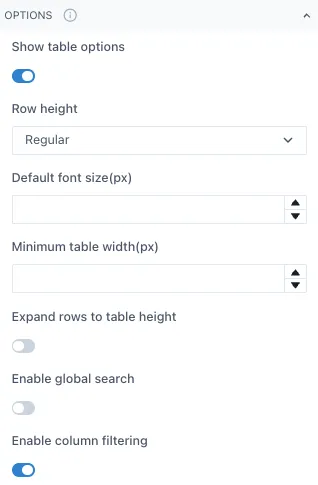
To modify a widget table, adjust the table settings such as row height, minimum table width, etc. under the Options section of the widget menu.
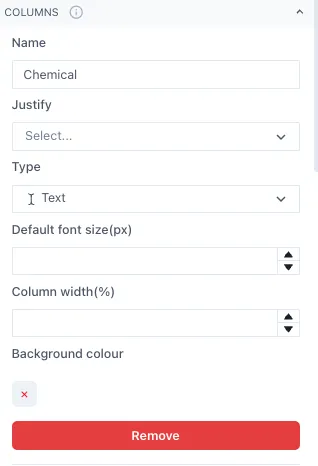
Next, set the number of columns and what type of data each will have under the Column section. The data type can change between columns but should remain the same within the rows of the same column. It is recommended to add names to each column but leaving the Name blank is also an option.
Once you have set up the columns, open the Rows section and start adding the Row 1 of your columns. Under each Row you should see all the column categories you set before.
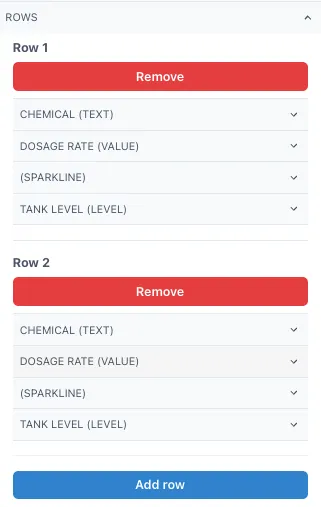
In this example we have 4 columns, each with different type of data and one of them without a name for the column. This set up would give the following table as result.
You can adjust the column width per column under the Column section of the menu, this will allow you to optimize the fit of the widgets in your table. Simply type a number between 0 and 1, taking into consideration that the sum of the columns should give 1 as total.