
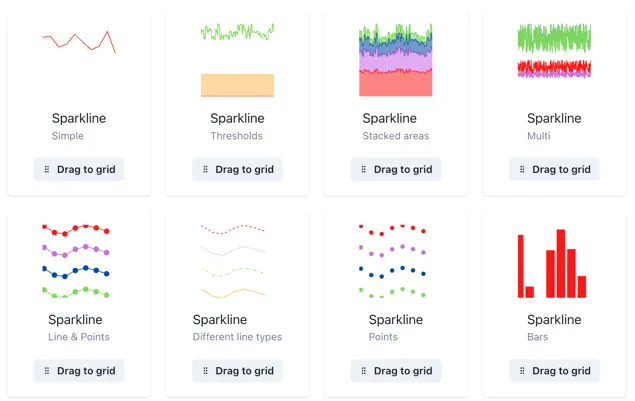
3.8 Sparkline
Sparklines are full Charts in disguise, therefore, they can be modified in the same manner as a Chart. You can explore different examples of sparklines by clicking the three-dot button in the sparkline option.

To add any of these templates to your dashboard just drag them into the grid and you can start editing them.
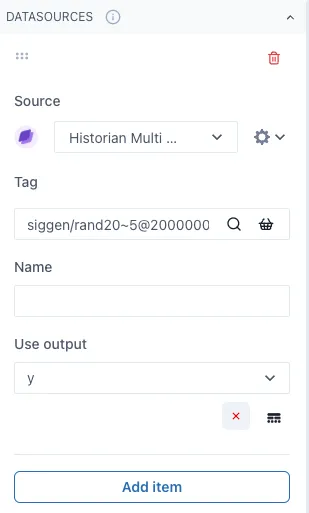
You can add the value under the Datasources section of the menu, clicking on the magnifying glass to add to search for tags or making calculations, making sure you have the correct source from the drop-down menu before.
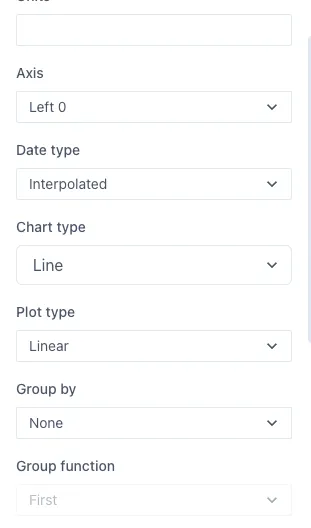
By clicking the Add item button below, you can keep on adding several values to the Sparkline as desired and the cog wheel next to the sources drop-down menu will open more options to modify the data shown such as the data type, chart type, plot type and if any grouping on the data.
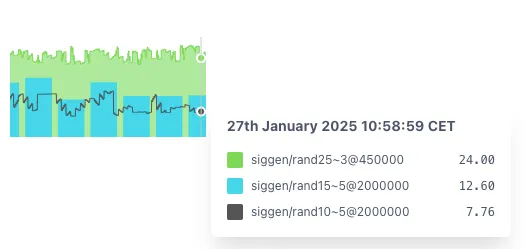
Same as in a chart, you can overlay several values with different chart types to create more complex displays. When out of edit mode, you can see the values within the sparkline by hovering over it.
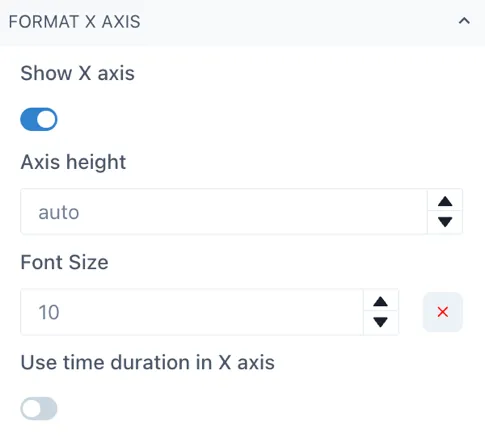
To modify the axes height, you can select the Format Y Axes or Format X Axis depending on the axis you wish to change. For the X axis, simply open the Format X Axis section and change the Axis height, it is by default on auto, but you can change it by clicking on the arrow button or by typing the number. Be sure to have the Show X axis toggle activated to see the changes you are implementing.
To change the Y axes, open the Format Y Axes section in the menu, you will see in bold the Y Axes you have in your sparkline or chart at the moment.
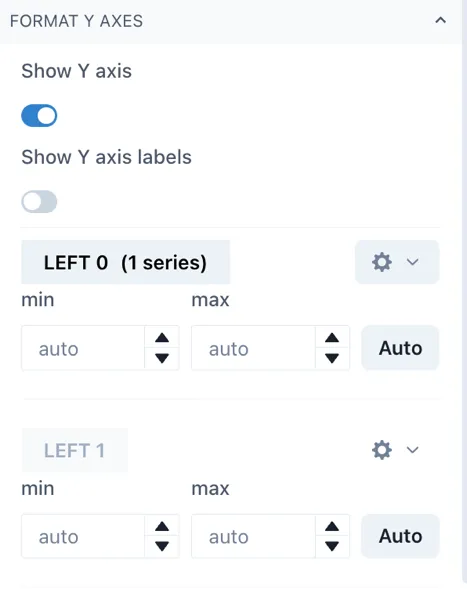
There are 4 left Axes and 3 right Axes in which you can chart your trends. Click on the cog wheel next to the axis you wish to change and then scroll down to the axis area width to modify the space between the widget edge and the axis.
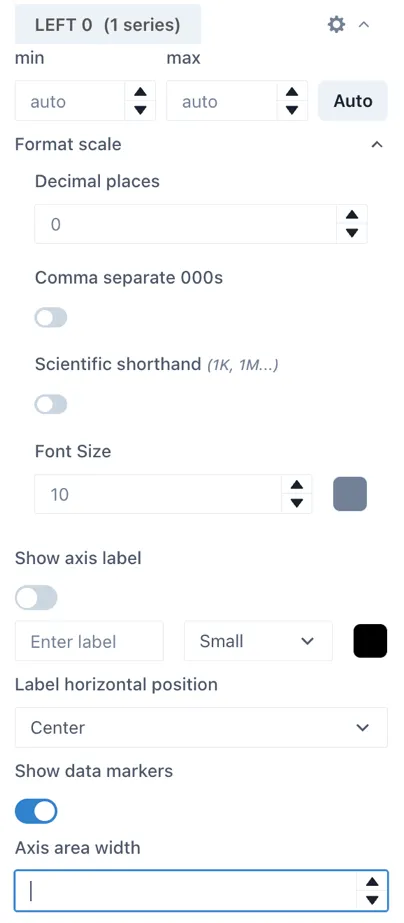
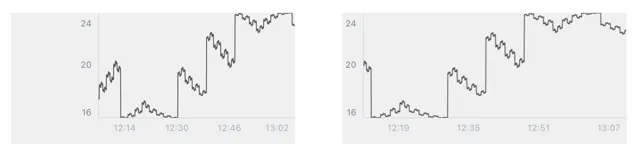
By default, the sparklines have a wide area between the edge of the widget and the beginning of the Y axis to accommodate for situations where you have several Y axes. Next, we have an example of a default sparkline and a sparkline with an area width of 24 for comparison while on edit mode. This translates to a sparkline or chart that occupies more of its widget space.
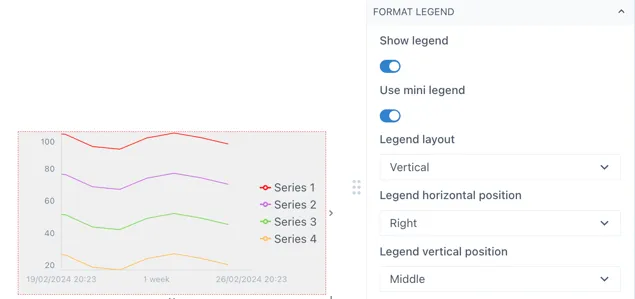
You can add or modify the format of a sparkline in the Format Legend section of the menu. In this section you can toggle the Show legend to activate it and the Use mini legend toggle to select between the mini legend or the more extensive legend. While working on a sparkline, it is recommended to use the mini legend to use the space more efficiently.
You can edit other aspects of the legend under the same section of the menu such as the legend vertical and horizontal position, the legend width, font size and if you want to wrap the levels. Next is an example of how you can modify mini legend for a sparkline.