
3.10 Event Track
Event track is useful for displaying intermittent data e.g. when a specific event occurs.
For example: tracking earthquake magnitudes, you may want to track when an earthquake happens or when an earthquake of a specific magnitude happens.
To add the event track to your dashboard, drag and drop from the widget menu.
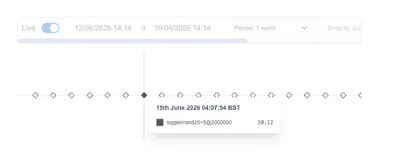
In the same way you would configure a chart, connect your datasource and configure the axis (see charts section).
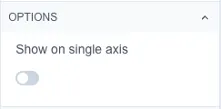
You can trend multiple datasources on the event track. By default, they will be on separate track lines, but you can toggle the show on single axis option to put them onto the same track line.
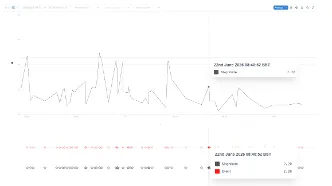
You can sync Event Tracks with charts for more detail into each event. (see sync section and live mode)