
3.9 Scatterplot
Scatterplots are charts preconfigured as scatterplots; therefore, they can be modified in the same manner as a Chart. Refer to Charts section.
To add the scatterplot to your dashboard, drag and drop from the widget menu.
What makes them different from standard charts is that, they are pre-set as chart type “points”
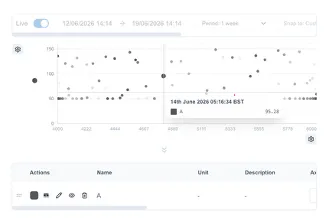
You can turn a standard chart into a scatter plot (and vice versa) by either:
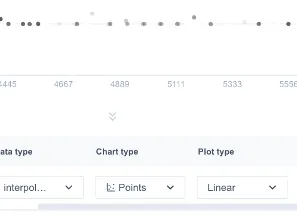
In edit mode: Clicking the chart and selecting chart type “points” under the source tab.
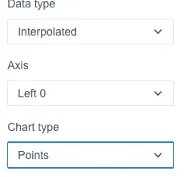
Outside edit mode: navigate to the display settings of the chart and edit chart type to be “points”.