

Grid Settings
2.4 Grid Configuration
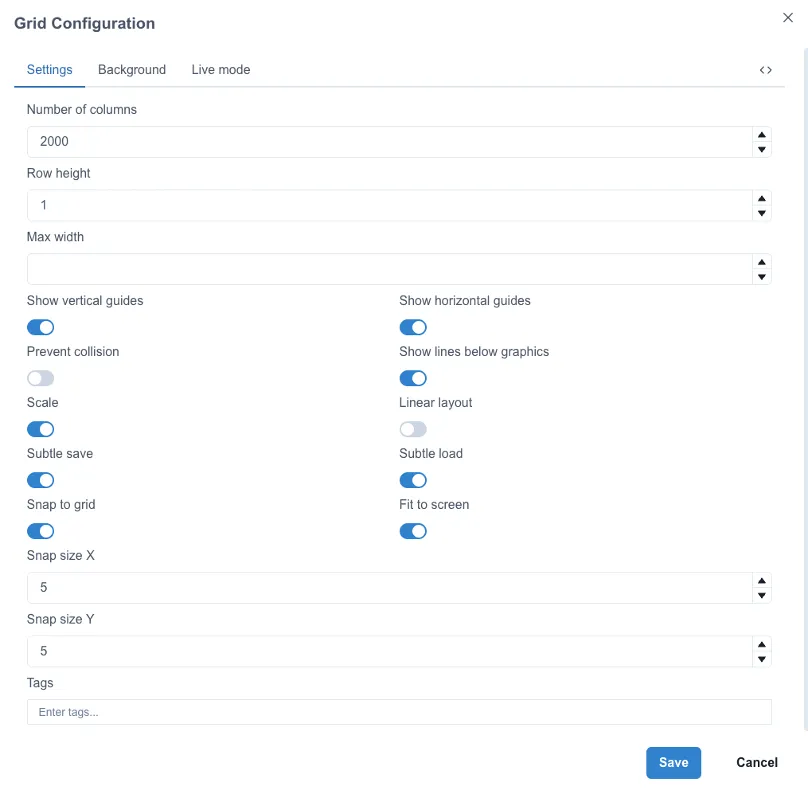
Section titled “2.4 Grid Configuration”Each type of dashboard has different grid settings applied to it. To change the grid settings of any dashboard or page, click on “Grid Settings” in the right-side menu when in Edit mode.

2.4.1 Settings tab
Section titled “2.4.1 Settings tab”In the setting section, we can adjust the following:
• Number of columns and height of the rows
• Max Width
• Show vertical and horizontal guides
• Prevent collision
• Show lines below graphics
• Scale
• Linear layout
• Subtle save and subtle load
• Snap to grid
• Fit to screen
• Snap size X & Y
• Tags
Number of columns and height of rows
Section titled “Number of columns and height of rows”To change the size of the grid, change the number of columns and the row height.
Vertical and horizontal guides
Section titled “Vertical and horizontal guides”The vertical and horizontal guides are what makes the grid visible while on Edit mode. These are ideal to use as reference when you want to place widgets perfectly aligned. These can be toggled separately depending on preference.
Prevent collision
Section titled “Prevent collision”Disabling “Prevent collision” will allow you to overlay widgets, which is ideal for having images or graphics with data on top of it.
Show lines below graphics
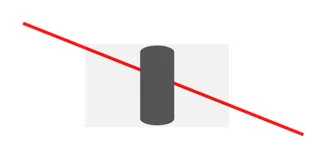
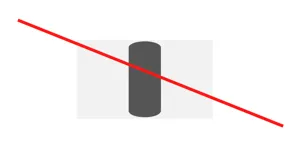
Section titled “Show lines below graphics”The “Show lines below graphics” will make the lines added from the Lines’ menu sit behind the graphics overlaid on them. This difference can be seen in the following image.
Subtle save
Section titled “Subtle save”Typically, making any change to a dashboard prompts a large, distracting “save” banner.
With subtle save enabled, the system differentiates between permanent configuration changes and temporary user interactions (like pinching, zooming, or re-adjusting axes on a chart). Instead of a large banner, you are prompted with a small, discreet save icon in the top right corner if you choose to persist those specific interactions.

Subtle load
Section titled “Subtle load”
This feature handles dashboard refreshes more elegantly. When a dashboard is set to refresh at a specific interval (e.g., every 30 or 90 seconds), subtle load prevents the entire screen from showing multiple widget-level “spinners” or reloading the browser. Instead, it indicates that the page is loading via a small spinner in the top right corner. The data values update seamlessly once retrieved, keeping the viewing experience smooth for users monitoring dashboards on public displays or in meetings.
Snap to grid
Section titled “Snap to grid”
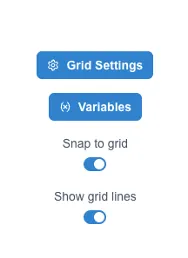
Instead of needing to manually align elements by zooming in and adjusting them on a pixel-by-pixel basis, this feature ensures that shapes, values, and lines automatically “snap” into alignment with a predefined grid.
This can also be adjusted outside of the grid settings on the right hand side.
Fit to screen
Section titled “Fit to screen”This will adjust the dashboard so that the whole dashboard will fit on the screen without any need to scroll.
2.4.2 Background tab
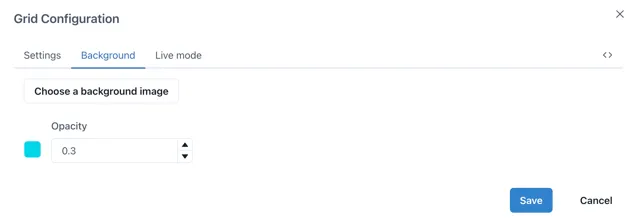
Section titled “2.4.2 Background tab”In the background section you can upload a background image or set a background colour. Remember you can adjust the opacity, 0 being completely transparent and 1 being not transparent at all.
2.4.3 Live mode tab
Section titled “2.4.3 Live mode tab”The Live mode lets you activate live mode for the dashboard, allowing widgets to be set to the current time. You can also choose whether the widgets should inherit these settings or maintain their own configuration as well as changing how often the data will update.
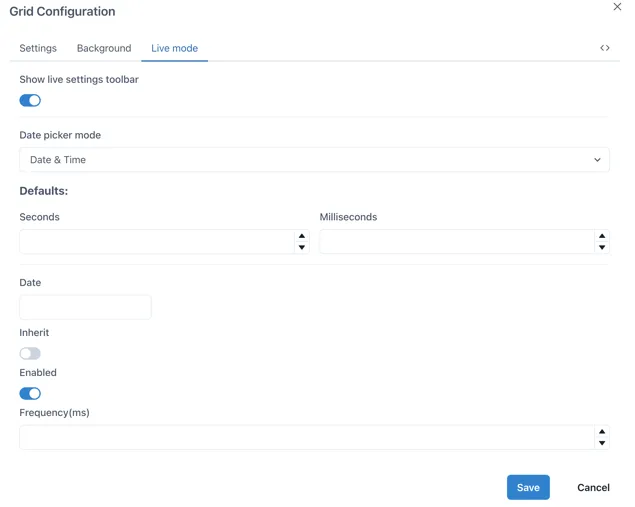
Showing the live settings toolbar will show a Live toggle on the top of the dashboard, which can be activated or deactivated and will change all the widgets in the dashboard to this time frame. When the toggle is off, you can select a specific date to set all the widgets to.

If you select a specific date in the Date section, the Live mode will be turned off and the data will not be updated, rather displayed for a fixed time frame according to your selection.
2.4.4 Editing JSON code
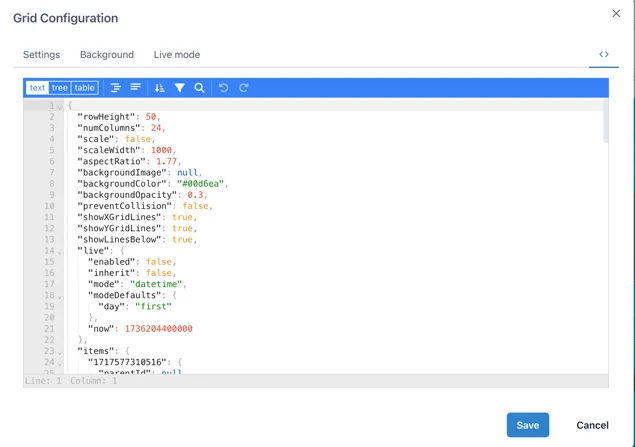
Section titled “2.4.4 Editing JSON code”The last section in the Grid configuration menu allows us to see the JSON code for the whole dashboard and it is signaled by the following button.

To copy the current dashboard to another page or dashboard, we can select the “text” option and copy all the code of the desired page into the code of the page where we want the copy to be in and click save. This will replicate the whole dashboard with all its widgets configured with the data sources from the original dashboard if available, yet images will have to be uploaded again in the destination page.
Each widget on the dashboard will have their individual JSON code, therefore if you wish to copy a single widget from a different dashboard into your own, you can access their JSON code by clicking on them while on Edit mode and selecting the JSON button on the bottom of the right-side menu.