

3.7 Chart
Charts can be set to live mode by activating the toggle Live on the top left corner of the chart. This will show you the period selected until the current date, you can change this period by selecting an option from the drop-down menu or by selecting Custom from the same menu and typing the preferred period of time.

This would be for example, 2M for 2 months. Other valid entries would be:
| s: | seconds |
| m: | minutes |
| h: | hours |
| d: | days |
| w: | week |
| M: | month |
| y: | year |
If you deactivate the live mode, the date selection next to the toggle will be available to select he specific dates you want to look for, or you can still use the drop-down selection menu. Once a chart is not in live mode, it will remain in the specified period, it will not be automatically updated. While live mode is deactivated you can quickly navigate through time with the back-and-forth buttons.

On the top right of the chart, you will see the following options.

You can add a new tag by clicking on the Add tag button or by dragging and dropping a tag from your basket. Another way to add a tag would be to go on Edit mode and select the Chart widget, opening its menu on the right side of the page. Under the Datasources section you will be able to add a new tag or modify the existing ones.
By default, the charts are “unlocked”, which allows users to zoom in by selecting a specific part of the chart and change the axis by scrolling while hovering over the axis. To revert the chart to its original position before zooming in, click on the undo button that will appear to the left of the Add tag button.
If you wish to keep the chart “locked in” or fixed, you can click on the lock button to set it fix. This is very useful when having dashboards and reports with multiple charts in them where you must scroll down to look at all the content.
In the cog wheel you will find some settings options such as the legend display, edit axis and title, and download options. The share button will open the chart in a new page, where you can save it or copy the URL to share it with more users.
The magnifying glass opens the chart in a pop-up window, allowing you to look at it in more detail, the changes done on the pop-up chart will not affect the original component. This option is ideal when you wish to look more into detail in a specific chart on a dashboard that contains several charts or widgets in it.
The last button with the arrows allows you to set the chart in seamless mode, hiding the top menu. To go out of seamless mode you click on the same button.
To edit the axis of the chart, you can click on the cog wheel in the top menu and select Edit Axes or directly select the cog wheel next to the axis.
In the legend you will be able to see all the tags and calculations on the chart and edit how they are displayed on it. It is recommended to add a name to each tag or calculation to identify them easily while on a chart.
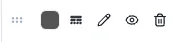
The 6-dot selector allows you to change the order of the tags included in the chart, the values added last will be displayed on top of the previous ones. Rearranging this order is important when you have a chart with lines, areas, bars, etc. To bring front a specific tag, move it to the bottom of the legend. See the next image as reference.
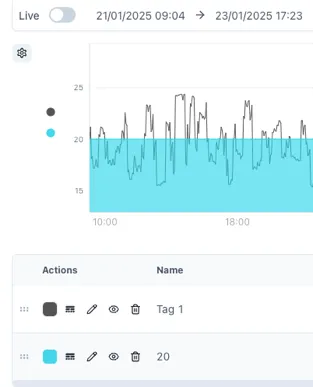
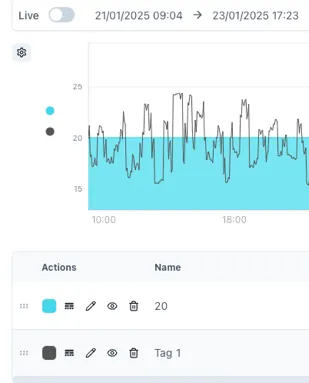
The rounded square button allows you to change the color of your tag or calculation. In the button with lines and dotted lines you can change the line of our tag from solid to dashed, dotted, etc. and change the line weight and point radius of it. The pencil button opens the tag or calculation, name, units and description. The eye button hides and unhides tags from the chart temporarily and the bin button deletes the tag from the chart.
Next we have the units and description of the tags in the chart as well as the axis in which they are shown, data type (auto, interpolated, raw), chart type (line, area, stacked area, bar, stacked bar, points and lines and points), plot type (linear, step, step before, step after, best fit), grouping (none, by hour, day, month, etc.) and group function if the data is grouped by.

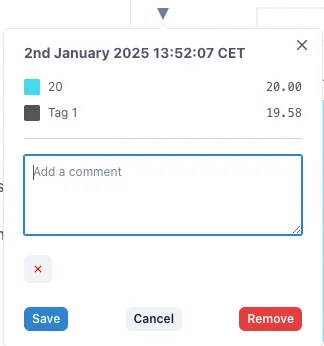
To add markers to your chart, hover over the point you want to mark and click the space bar. This will add a subtle vertical marker in this position. To add a comment to this marker, you can click on the little triangle above the marker.
Further information on the Chart widget and its configuration can be found in the Charts Product Manual.