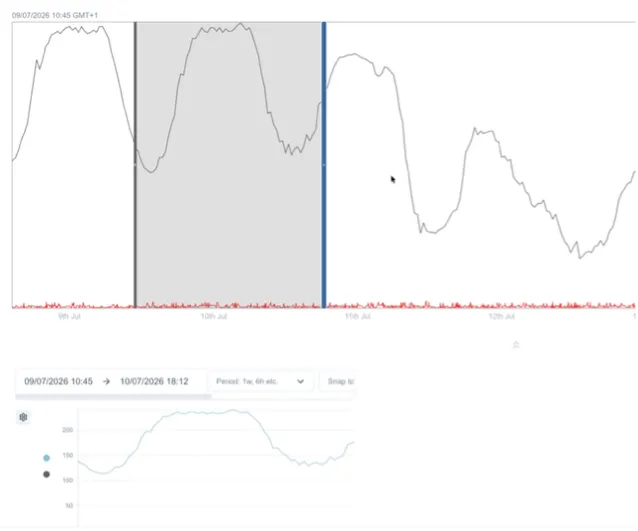

3.12 Brush Chart
A brush chart is a time-series chart with an additional overview strip, featuring a draggable, resizable selection window (the “brush”). Dragging or resizing this window highlights that specific time range, letting you inspect detail such as a pressure spike or equipment trip without losing sight of the broader trend.
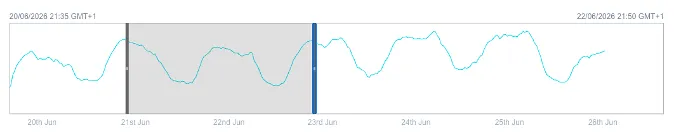
Brush charts are charts preconfigured as brush charts; therefore, they can be modified in the same manner as a Chart. Refer to chart section
To add the brush chart to your dashboard, drag and drop from the widget menu.
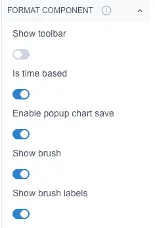
What makes them different from standard charts is that they are pre-set with the “show brush” and “show brush labels” toggled on. They will also have a tag (e.g. “brush”) already added in the Tags section.
You can sync the brush to other charts on the dashboard by applying the same tag to each chart. See Sync section
When synced, dragging or resizing the brush window will drive the visible time range of all tagged charts to match the inner bounds of the brush selection.