3.13 Level
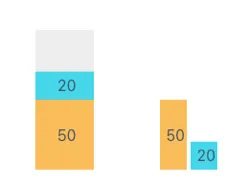
Levels can have one or multiple values within the same widget. You can see some level templates or examples in the three-dot button in the Level section of the Widget menu.
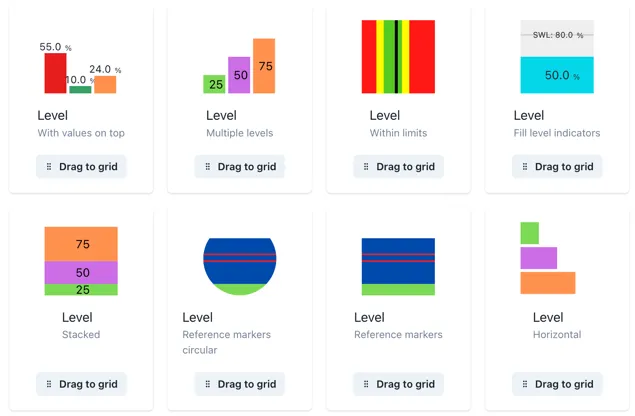
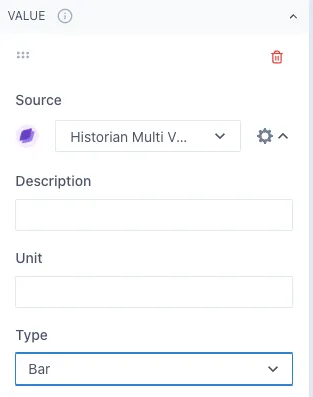
Under the Value section of the widget menu, you can select the tags or calculation you want to display in a level as well as adjust its color. In the cog wheel next to the source, you can see more options to modify this item. Under Type, you can select if you want to display it as a bar or a line in the level. The line option is ideal for displaying a threshold value of reference for the tag you are evaluating.
Under the Min/Max values section of the menu, you can adjust these values by changing the fixed value or using a tag or calculation for the minimum and maximum of the level.
You can display or hide the values of the level in the Format value section. If you add multiple items in the same level as bars, they will be initially set as stacked bars. If you wish to change this, go to Format bars and change the Stacked bars toggle.