

3.27 Map
The Map component displays geographic data on your dashboard. Any data source that provides data in GeoJSON format can be plotted on the map, and the map can be configured to update in real time.
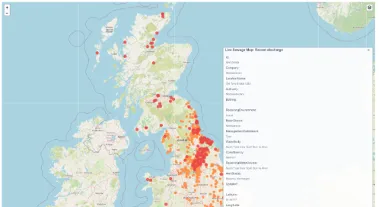
For example: Plotting sewage discharges across the UK, colour-coded by recency.
To add the map component, drag and drop from the widgets menu.
Navigating the map
Zoom in/out – use the plus (+) and minus (−) buttons.
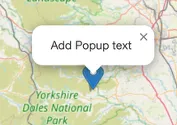
View point details – click on a point to open a pop-up tooltip and see the additional properties stored in its GeoJSON file.
Setting up a map
There are two ways to add points to a map: by connecting a GeoJSON data source, or by manually placing markers.
Option 1: Connect a GeoJSON data source
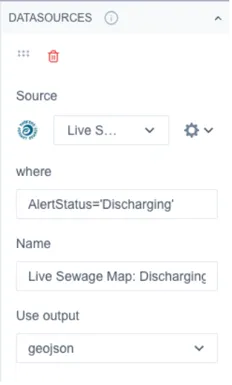
- Source - Add a GeoJson data source.
- Where – apply a filter to narrow down which data is displayed. For example, you could filter so only data with the Alert Status “Discharging” is shown.
- Name – give the data source a variable name to identify the specific data source.
- Use output - GeoJSON output – this is set as the default.
- Once your data source is set up, add it to the map as a layer:
Option 2: Manually place markers
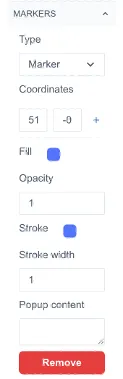
To add points manually rather than connecting a data source, add a marker in the Layers section and enter coordinates directly (see Layers section below).
Display settings – configure colour, opacity and width.
Popup content – add content that you want to show when you click on the marker.
Add layer
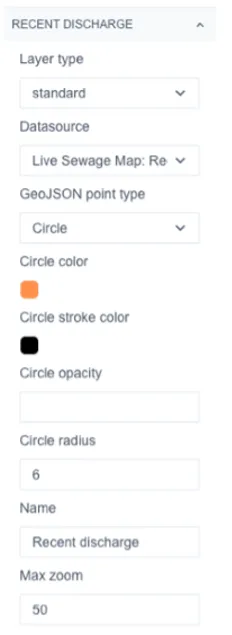
- Layer type – select “Standard” (additional layer types are coming soon).
- Datasource – choose from the data source(s) you’ve added, using the name you gave them.
- GeoJson point type – choose between Marker and Circle.
- Display settings – configure colour, opacity, radius, and max zoom.
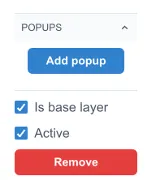
- Enable popups – allows users to click markers to view more information.
- Remove – Remove layer.
Format component
- Set the default zoom level and starting location for the map.
- The following settings work the same as other widgets: Live mode, Background, Tags, Visibility, Type.