
3.11 Radar Chart
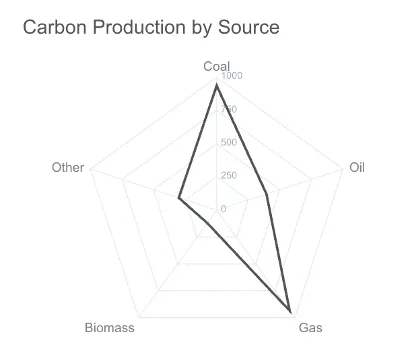
The Radar component displays multi-variable data as a radar (spider) chart, with each variable plotted as a vertex and each data series plotted as a line connecting those vertices.
Radar Settings
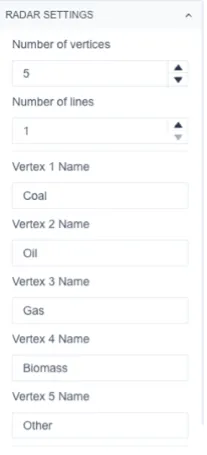
Number of vertices – choose how many vertices (axes) the radar chart will have.
Number of lines – choose how many lines (data series) will be plotted on the chart.
Vertex name – once you’ve selected the number of vertices, a name field will appear for each one (e.g. Vertex 1 name, Vertex 2 name). These names are displayed at each point on the radar chart.
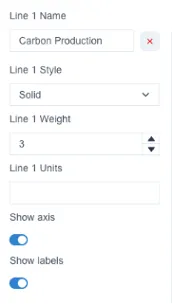
Line name – once you’ve selected the number of lines, a name field will appear for each one. These names appear on hover when you point at a line on the chart.
Line style and weight – configure the style (solid, dashed, dotted, dash-dot, dot-dash) and weight/thickness for each line.
Line units – set the unit to display alongside the value on hover.
Show axis and labels – toggle the chart’s axis and labels on or off.
Values
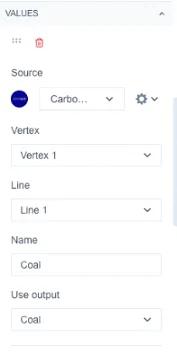
For each vertex, connect a data source and specify:
Vertex – which vertex this data source maps to.
Line – which line this data source belongs to.
Output – which output from the data source to use.